Release Notes - v12.4
import { Aside } from ‘@astrojs/starlight/components’
Here’s a look at the major updates from this milestone. ✨
Section titled “Here’s a look at the major updates from this milestone. ✨”✨ 100% Stacked Bar & Column Charts
Section titled “✨ 100% Stacked Bar & Column Charts”We have introduced a new charting option: 100% Stacked Bar and Column Charts.
- Previously, in standard stacked bar and column charts, when some values were very small, their visual representation would also be very small, making them hard to compare or even visible at times.
- The new 100% stacked view solves this by ensuring that every stack occupies 100% of the available width (for bar charts) or height (for column charts).
- The individual segments within the stack are then shown as a percentage relative to the total, making it much easier to compare relative contributions across different categories.
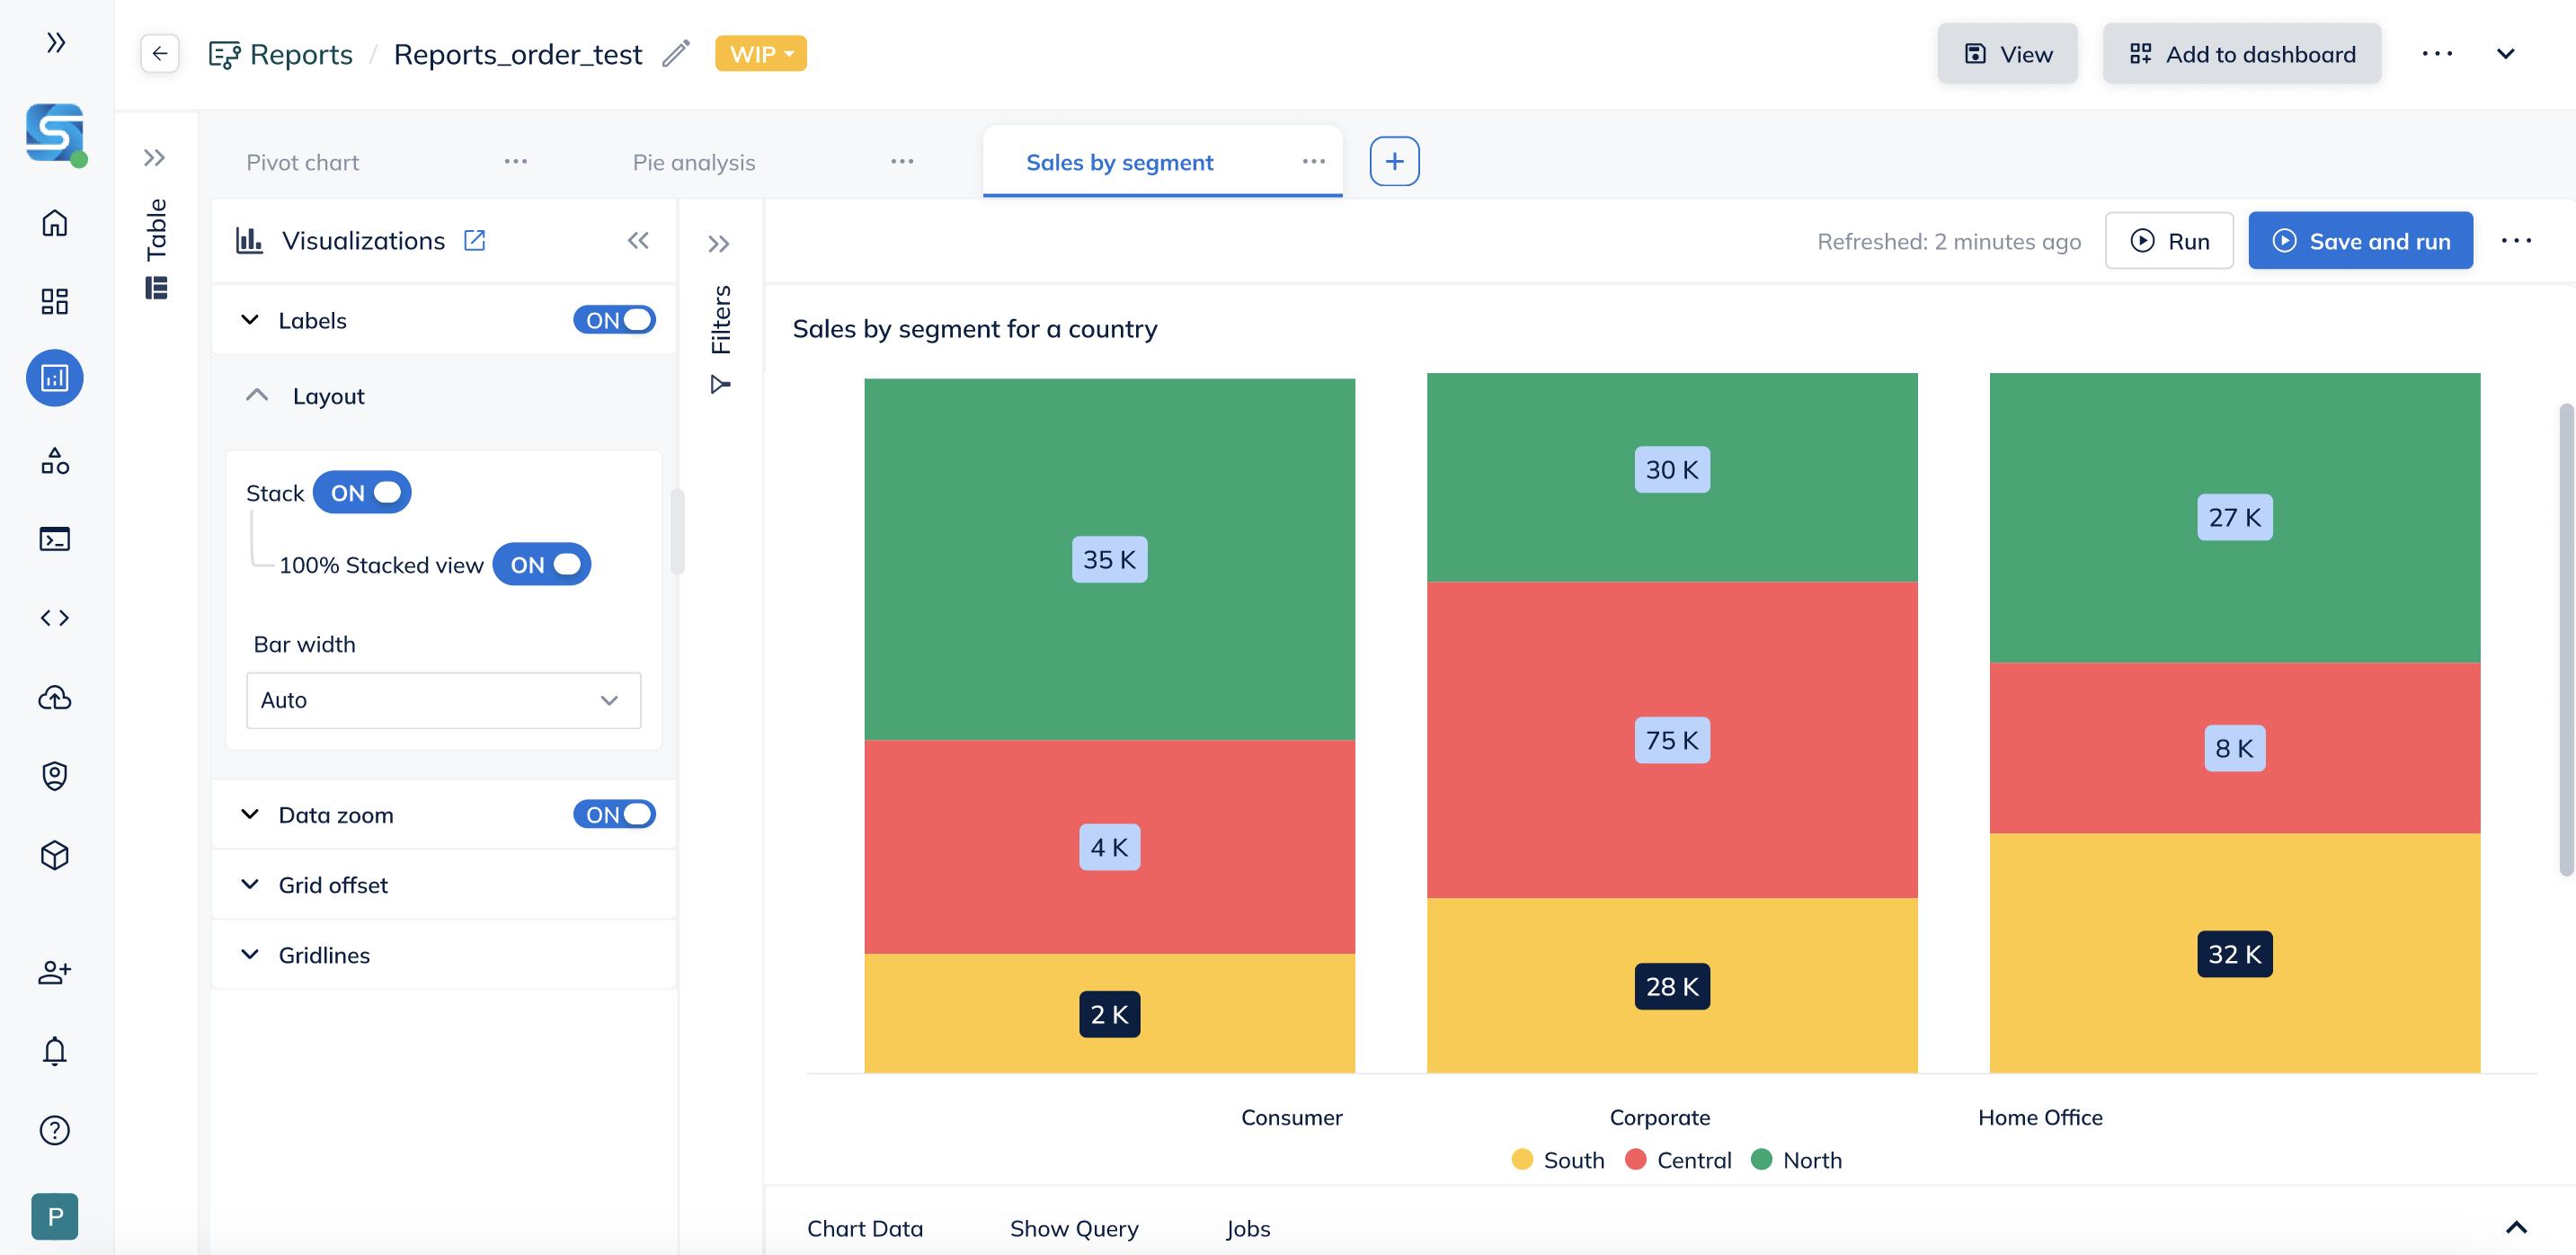
100% Stacked Column Chart
🖌️ How to use:
Section titled “🖌️ How to use: ”- While building a bar or column chart, go to the Format section.
- Under Layout, when stacking is enabled, you will find a toggle for 100% Stacked View.
- Turn the toggle ON to switch to the 100% stacked representation.
Also, we have improved the stacking toggle behaviour
Section titled “Also, we have improved the stacking toggle behaviour”- The stacking toggle will appear only when multiple Y-axes or a single Y-axis with a category column is added in the Build section.
- In other cases, stacking is not applicable and the toggle will remain hidden.
🐞 Other Fixes & Improvements
Section titled “🐞 Other Fixes & Improvements”Fixed:
- Issue where applying total pivot was not showing values for all columns.
- Test connection issue for Zoho Invoice integration.
- Commented code in expression with variables was not being ignored.
Backend improvements for:
- Salesforce Ingest v2
- BigQuery Ingest v2
- Zendesk Support & Chat Ingest v2
- API Pulls to use new ingestion APIs
✨ That’s all for this release. As always, we’re constantly working to improve your experience.
We hope these enhancements improve your experience with Sprinkle.