Release Notes - v10.5
import { Aside } from ‘@astrojs/starlight/components’
Here’s a look at the major updates from this milestone. ✨
Section titled “Here’s a look at the major updates from this milestone. ✨”ℹ️ Dynamic Values for Variables at the Report & Model Level
Section titled “ℹ️ Dynamic Values for Variables at the Report & Model Level ”You can now dynamically populate variable values directly from your data instead of manually entering them.
Here’s how it works:
- Select a table -> then choose the column you want to ingest data from.
- The values from the chosen column will be populated into the variable.
- These values will also appear in the default variable value field.
- Available for Picklist, Multi-select Picklist & Type-In & Picklist input methods.
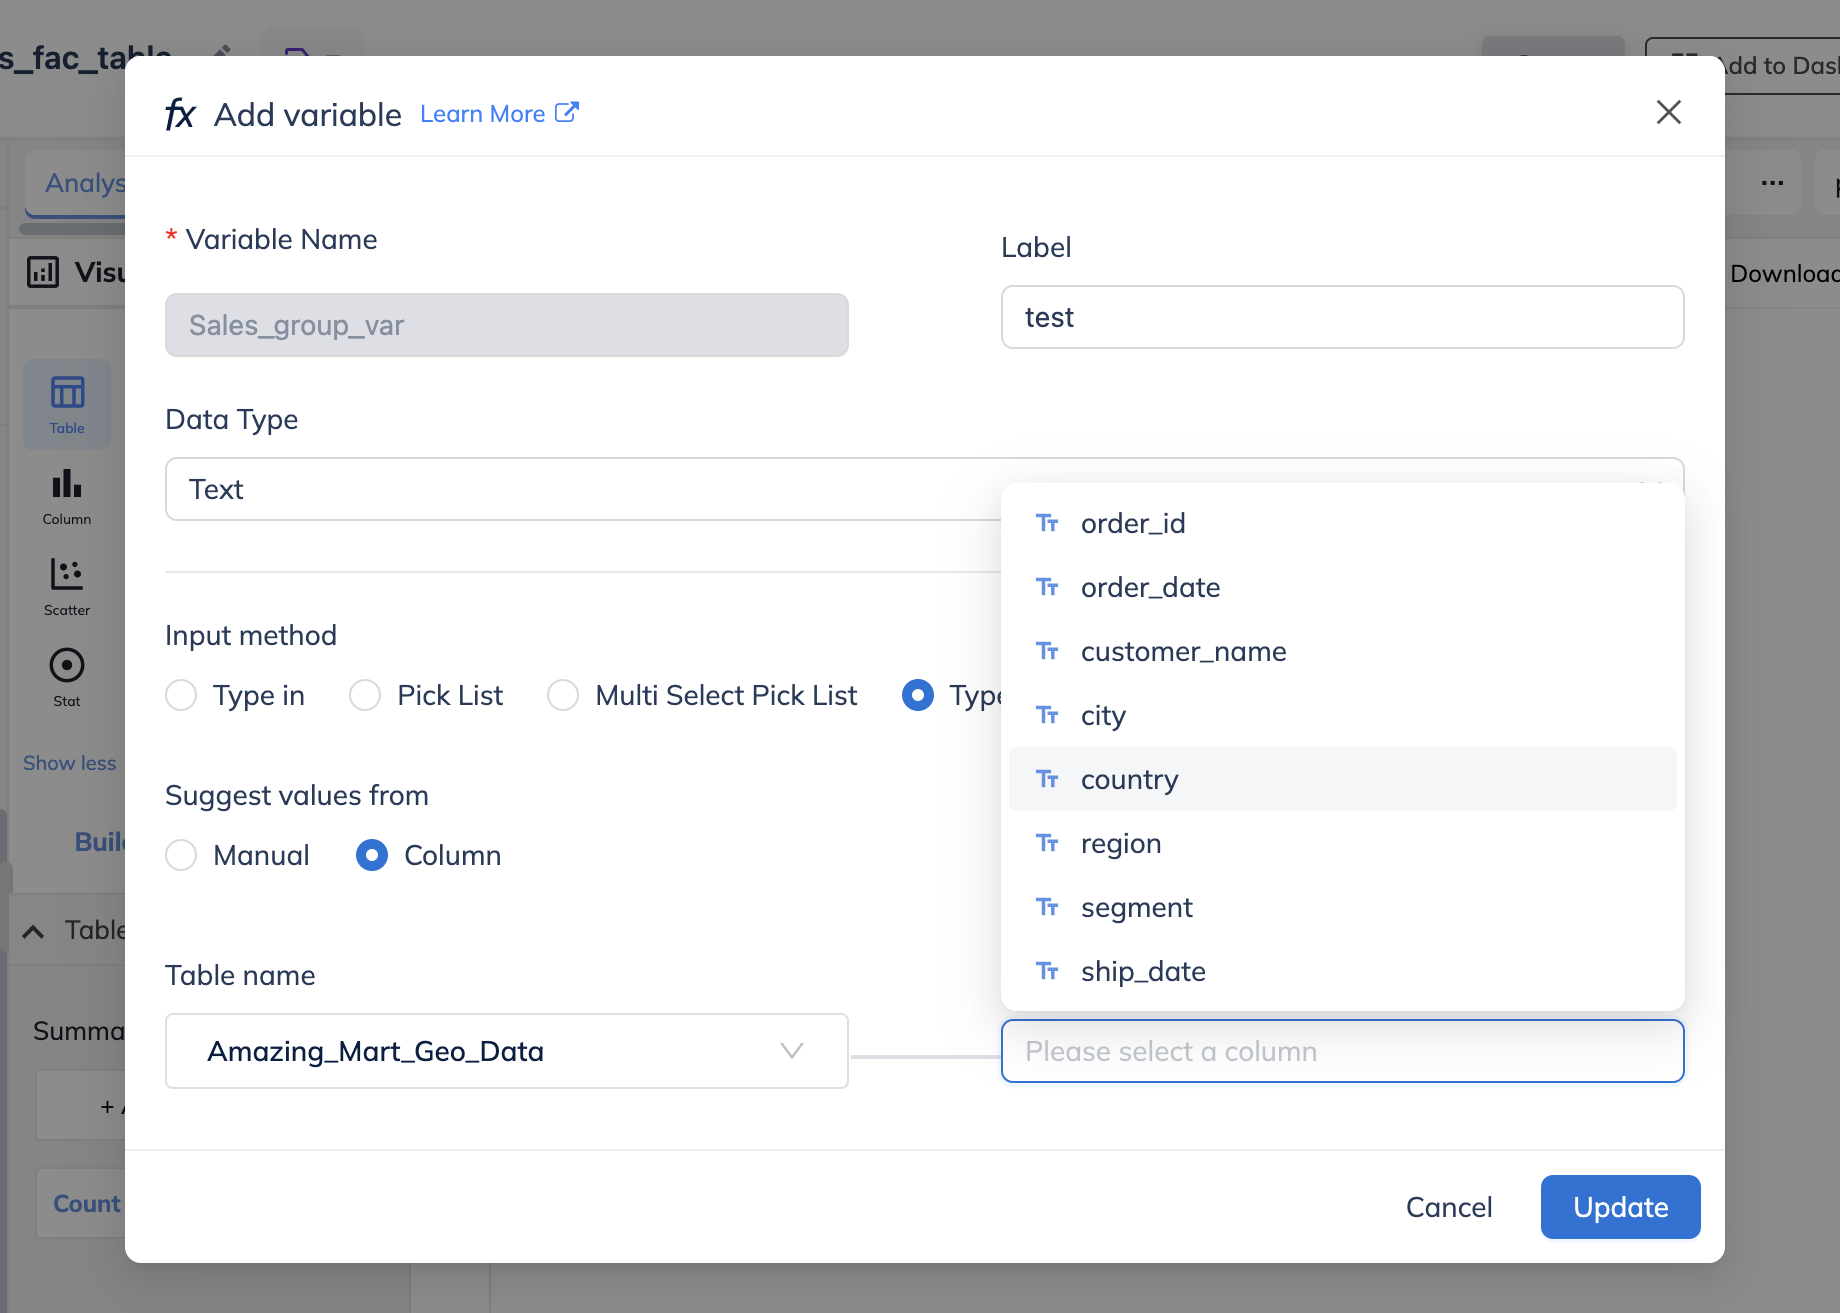
Populating values in variables from a column
This enhancement makes variable selection more efficient and scalable for reports and models.
🧠 Dynamic Variable Filter Values at Dashboard Level
Section titled “🧠 Dynamic Variable Filter Values at Dashboard Level ”Managing variable filters at the dashboard level is now easier with an automatic value population.
Previously, you had to enter values for variable filters manually. Now, you can choose the variable option to populate values dynamically.
- The filter values can be fetched from a variable used in one of the selected tiles.
- These dynamically populated values will also appear in the default filter state, making them easily accessible in variable filters.
- Available for Picklist, Multi-select Picklist & Type-In & Picklist input methods.
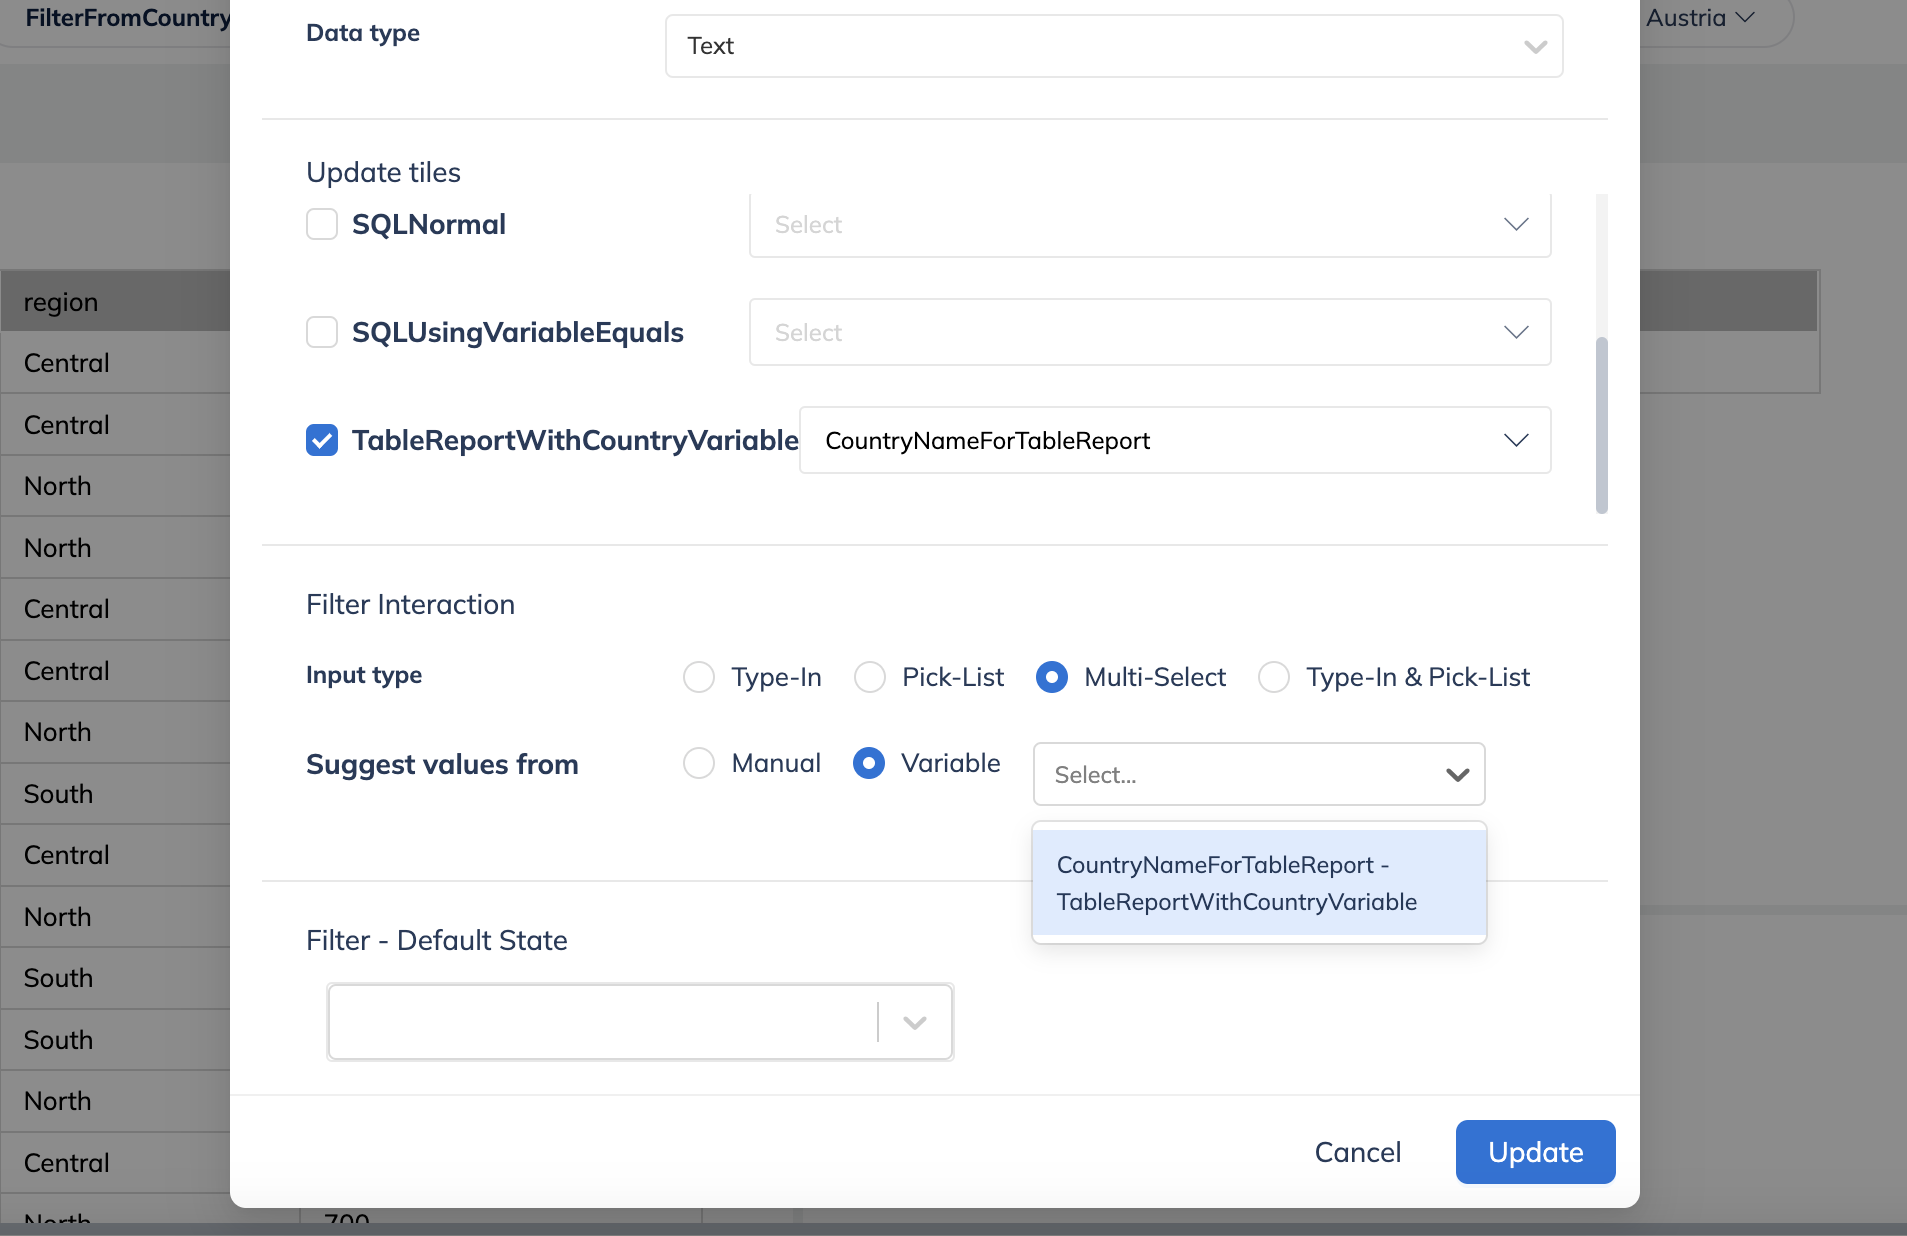
This update simplifies dashboard-level filtering by reducing manual inputs and leveraging existing variable data.
🔔 Clear all alerts
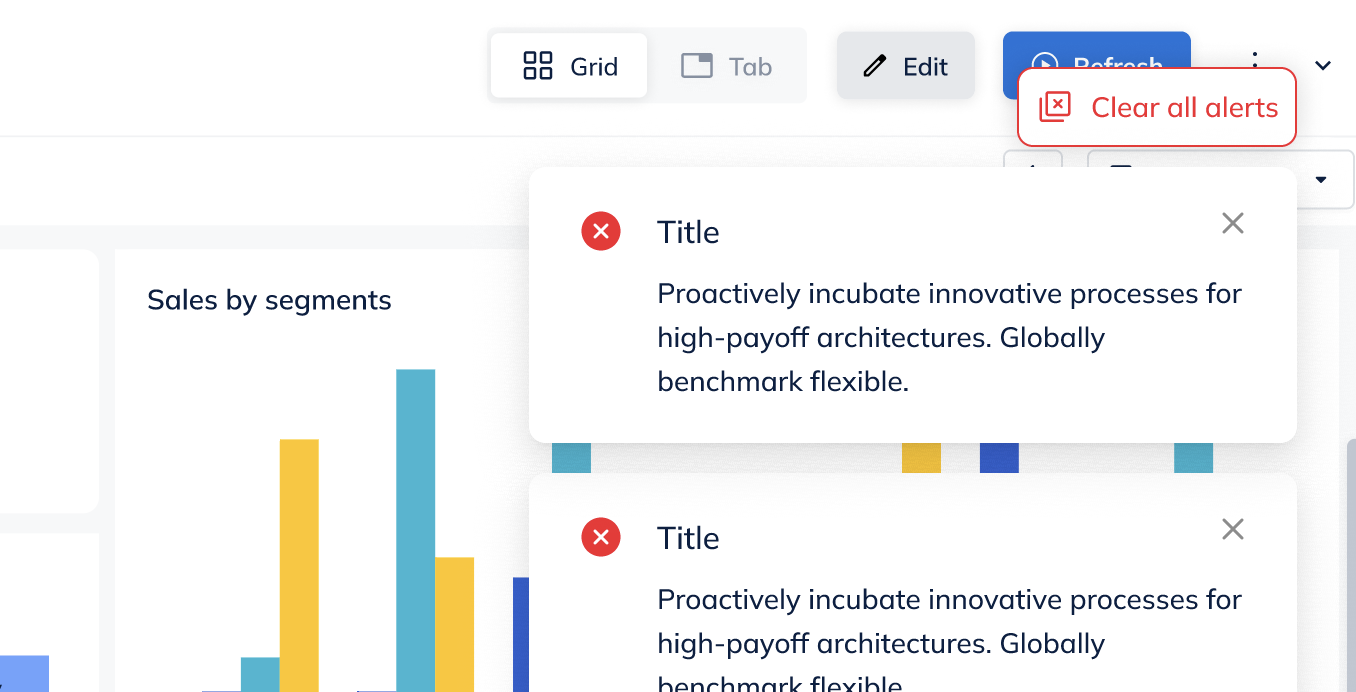
Section titled “🔔 Clear all alerts”Clear All Alerts in One Click Tired of multiple alerts cluttering your screen?
We’ve introduced a “Clear All Alerts” button that allows you to dismiss all active alerts at once, keeping your workspace clean and distraction-free.
📊 Improved Bar Chart Readability
Section titled “📊 Improved Bar Chart Readability ”To enhance visualization clarity, we’ve made a key update to the bar charts:
- Y-axis labels are now clipped at 30 characters, ensuring they don’t take up too much space in the chart area.
- If a label exceeds 30 characters, it will be clipped, but you can hover over the corresponding bar to view the label’s full content. This ensures better chart visibility while preserving important details.
✨ We hope these enhancements improve your experience with Sprinkle.